Image Details
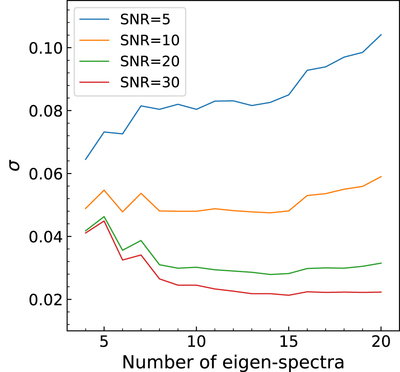
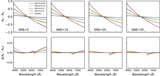
Caption: Figure 5.
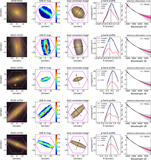
Tests on the effects of different number of eigenspectra. Here the standard deviation (σ) of the difference between the output and input E(B − V) values is plotted against the number of eigenspectra. S/Ns are indicated in this figure.
Other Images in This Article

Show More
Copyright and Terms & Conditions
© 2020. The Author(s). Published by the American Astronomical Society.
Copyright ©
2025 Astronomy Image Explorer. All Rights Reserved.