Image Details
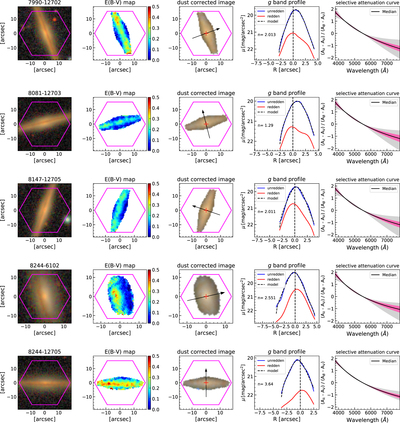
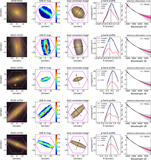
Caption: Figure 9.
There are five panels in each row. The first one is the SDSS gri color-composite image with the MaNGA footprint in magenta. The second one is the E(B − V) map derived from our method. The third one is the dust-corrected gri color-composite image. The red plus sign shows the center of the integral field. In the fourth panel, the red line is the reddened brightness profile, while the blue line is the unreddened brightness profile along the direction of arrow in the third panel. The unreddened brightness profile is fitted by a model that the black dashed line shows. n is the key parameter of this model. The last panel shows the selective attenuation curves measured from our method. The black solid line is the median, the pink region shows the standard deviation of the spaxels around the median, and the gray region covers the range spanned by all the individual spaxels.
Other Images in This Article

Show More
Copyright and Terms & Conditions
© 2020. The Author(s). Published by the American Astronomical Society.