Image Details
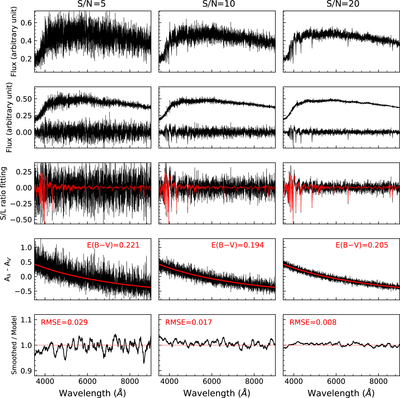
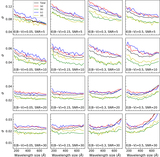
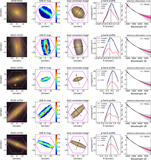
Caption: Figure 3.
Examples of the fitting procedure for measuring relative dust attenuation curves and E(B − V). Panels from left to right correspond to three mock spectra with different S/Ns: 5, 10, and 20. The mock spectra are constructed from the same intrinsic dust-free spectrum and are reddened with a Calzetti attenuation curve assuming a color excess of E(B − V) = 0.2. The top panels display the mock spectra, and panels in the second row show the small- and large-scale components of each spectrum. In the third row, the black line in each panel is the ratio of small- to large-scale components (S/L), while and the red line plots the S/L of the best-fitting model spectrum. In the fourth row, the black line is the recovered relative attenuation curve and the red line is the input attenuation curve. The E(B − V) estimated from the measured attenuation curves is 0.221, 0.194, and 0.205 respectively, as indicated. In the bottom panels, the black lines show the ratios of the measured attenuation curve (smoothed for clarity) to the input one. The root mean square error (RMSE) of these curves is 2.9%, 1.7%, and 0.8%, also indicated.
Other Images in This Article

Show More
Copyright and Terms & Conditions
© 2020. The Author(s). Published by the American Astronomical Society.