Image Details
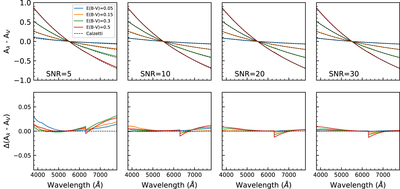
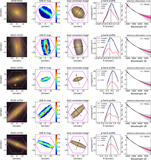
Caption: Figure 8.
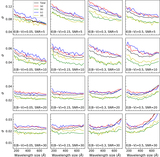
The first row shows the medians of all relative dust attenuation curves in each E(B − V) and S/N bin. The second row shows the differences between the median curves and the Calzetti curve.
Other Images in This Article

Show More
Copyright and Terms & Conditions
© 2020. The Author(s). Published by the American Astronomical Society.
Copyright ©
2025 Astronomy Image Explorer. All Rights Reserved.