Image Details
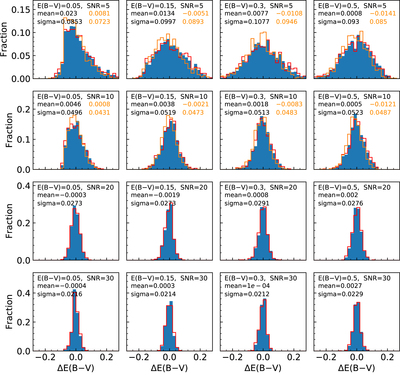
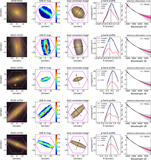
Caption: Figure 7.
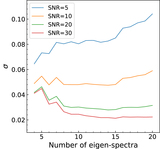
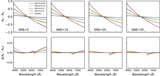
Tests with mock spectra that have different E(B − V) values and S/Ns. Here the distribution is shown with respect to ΔE(B − V), the difference between the fitting result of E(B − V) and the input value. The input E(B − V) and S/N are indicated in each panel. The mean value and standard deviation of ΔE(B − V) are indicated by “mean” and “sigma”, respectively. For all cases, we choose a wavelength window size of 300 Å. The red histograms show the results of “unreasonable” spectra that are located in the upper right and lower left corners of Figure 4. For lower-S/N spectra with S/N = 5 and 10, we also show the test for a window size of 500 Å, plotted as the orange histograms in the top two rows.
Other Images in This Article

Show More
Copyright and Terms & Conditions
© 2020. The Author(s). Published by the American Astronomical Society.