Image Details
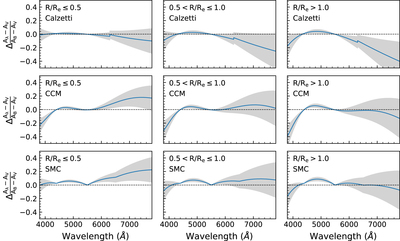
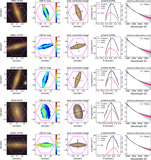
Caption: Figure 11.
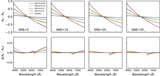
Differences of the fitted Calzetti (top panels), CCM (middle panels), and SMC (bottom panels) model curves relative to the measured selective attenuation curve of the 15 MaNGA galaxies. Panels from left to right are the results for spaxels at three different radial intervals as indicated. In each panel, the solid blue line is the median of all the spaxels at the given radii, and the gray region indicates the standard deviation of the spaxels.
Other Images in This Article

Show More
Copyright and Terms & Conditions
© 2020. The Author(s). Published by the American Astronomical Society.
Copyright ©
2025 Astronomy Image Explorer. All Rights Reserved.