Image Details
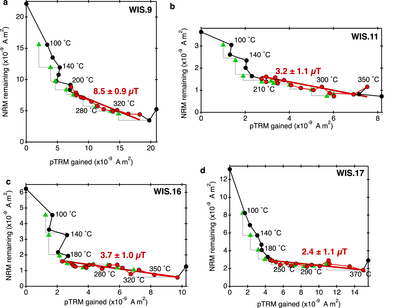
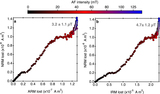
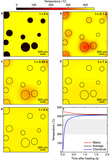
Caption: Figure 8.
Double heating paleointensity analyses of WIS 91600. The NRM remaining in each sample is plotted against its pTRM gained during the double heating measurements (Arai diagram) measured for all four subsamples with low DRATS values and did not display visibly poor Arai diagrams. The HT component is depicted by the red points, and the recovered paleointensity from each subsample is denoted by the red least-squares fit line and the red text. The temperature corresponding to some of the heating steps points during thermal demagnetization is shown by the black text. The pTRM checks are shown by the green triangles, and the proceeding thermal step is depicted by the gray lines.
Other Images in This Article
Show More
Copyright and Terms & Conditions
© 2020. The American Astronomical Society. All rights reserved.