Image Details
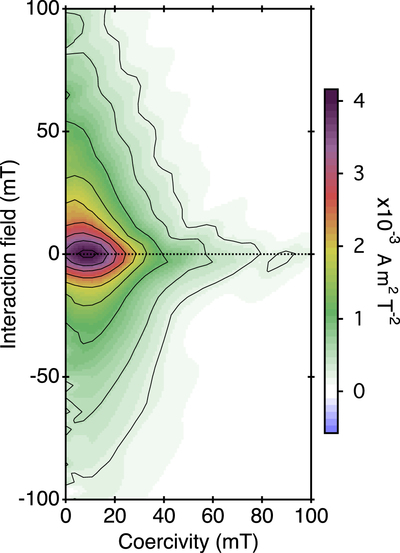
Caption: Figure 1.
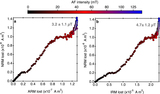
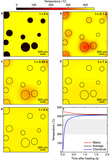
First-order reversal curve (FORC) diagram of WIS.2. The diagram shows a distinctive triangular shape. The FORC distribution extends vertically to interaction fields of ±∼100 mT at low coercivities and horizontally to a coercivity of ∼100 mT at near-zero interaction fields. The diagram contains a peak at Hc ≈ 10 mT and Hu ≈ 0 mT.
Other Images in This Article
Show More
Copyright and Terms & Conditions
© 2020. The American Astronomical Society. All rights reserved.
Copyright ©
2025 Astronomy Image Explorer. All Rights Reserved.