Image Details
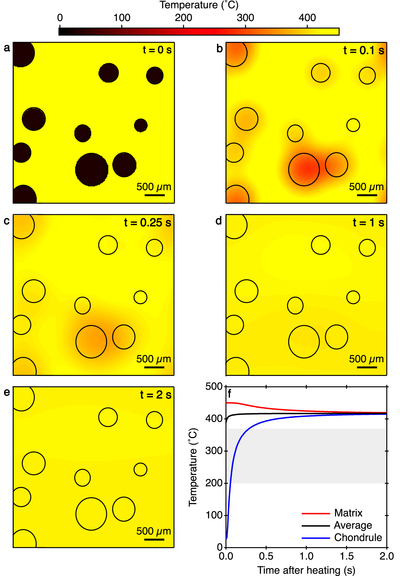
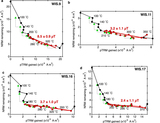
Caption: Figure 10.
Results of our thermal evolution modeling of a chondrite immediately following matrix heating by the passage of an impact pressure wave through the sample. (a) Initial thermal state consisting of cold (25°C) chondrules and heated (450°C) matrix. The size distribution and abundance of chondrules match those observed experimentally for WIS 91600 (Birjukov & Ulyanov 1996; Choe et al. 2010). (b)–(e) Thermal state of the chondrite at 0.1 s, 0.25 s, 1 s, and 2 s, respectively, after heating. The whole assemblage has reached a near-isothermal state by 2 s after heating. (f) The calculated thermal evolution of the center of the largest chondrule, the center of the largest area of matrix, and the average of the whole assemblage. The matrix cools from 450°C to ∼415°C and the chondrules heat up from 25°C to ∼415°C in <2 s. The temperature range over which we recovered our HT paleointensity is depicted by the gray bar. None of the material in our model cools through this temperature range within the first 2 s following heating.
Other Images in This Article
Show More
Copyright and Terms & Conditions
© 2020. The American Astronomical Society. All rights reserved.