Image Details
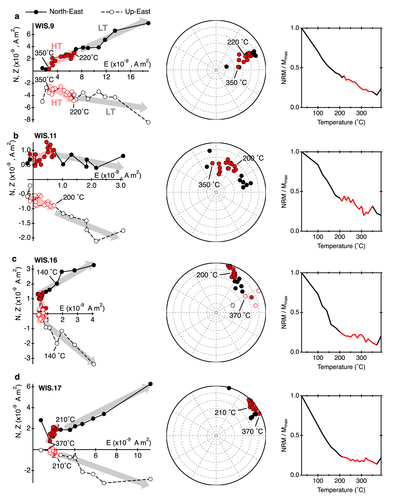
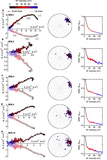
Caption: Figure 7.
Demagnetization of the NRM carried by our thermal subsamples with low difference ratio sum (DRATS) values that did not display visibly low-quality demagnetizations. Shown on the left are orthogonal projections of the end points of the NRM vectors onto the North–East (filled points) and Up–East (open points) planes during thermal demagnetization. The LT components are shown by black points and gray arrows, and the HT components are shown by the red points and pink arrows. Shown in the center are stereographic projections of the direction of the NRM vector that remains after heating to increasingly higher temperatures. Shown on the right is the variation of the NRM normalized to the maximum magnetization value (Mmax) as a function of temperature.
Other Images in This Article
Show More
Copyright and Terms & Conditions
© 2020. The American Astronomical Society. All rights reserved.