Image Details
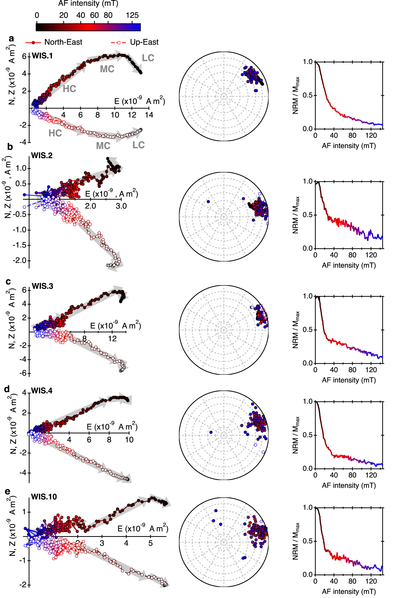
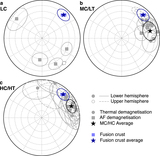
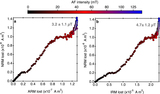
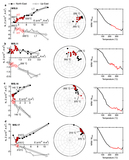
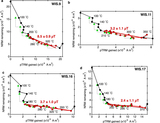
Caption: Figure 4.
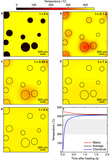
Alternating field (AF) demagnetization of the NRM carried by our AF subsamples. Shown on the left are orthogonal projections of the end points of the NRM vectors onto the North–East (filled points) and Up–East (open points) planes during AF demagnetization. The gray arrows depict the directions of the LC, MC, and HC components. Shown in the center is the direction of the NRM vector that remains after the application of increasingly intense alternating fields in an equal area stereographic projection. The intensity of the alternating field is depicted by the color scale. Shown on the right is the variation of the NRM normalized to the maximum magnetization value (Mmax) as a function of applied AF intensity.
Other Images in This Article
Show More
Copyright and Terms & Conditions
© 2020. The American Astronomical Society. All rights reserved.