Image Details
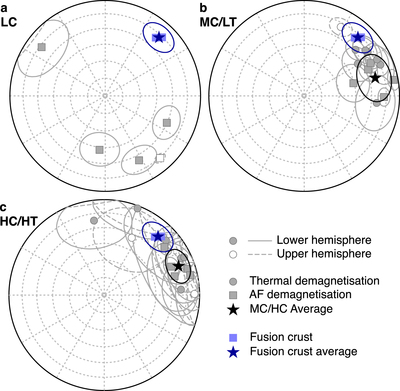
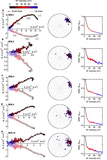
Caption: Figure 5.
Equal area stereographic projections of the directions of (a) the LC component, (b) the MC and LT components, and (c) the HC and HT components of our subsamples. The components recovered from individual interior subsamples are shown by the gray points. The single components recovered from the fusion-crusted subsamples are shown by the light blue points. The average MC and HC directions are depicted by the black stars in (b) and (c), respectively, and the average fusion crust direction is depicted by the dark blue star in (a)–(c). The ellipses around the directions recovered from the individual subsamples are MAD values of each subsample, and the ellipses around the average values are α95 values.
Other Images in This Article
Show More
Copyright and Terms & Conditions
© 2020. The American Astronomical Society. All rights reserved.