Image Details
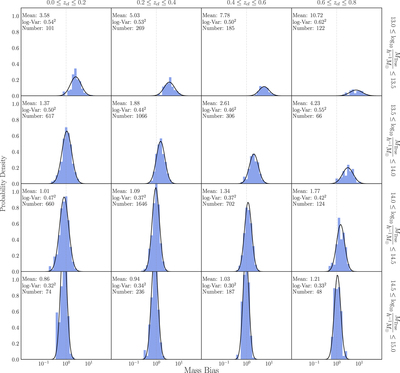
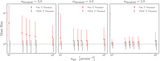
Caption: Figure 9.
The histograms show the probability density function (pdf) of the mass bias (Equation (26)) in a 4 × 4 grid in redshift and mass. The mean of the distribution and the variance in logarithmic space are quoted in the upper left corner in each panel. In each panel, a lognormal pdf according to these two parameters is overplotted by a solid line to see how well the distribution is described by the lognormal form. These histograms are based on an ngal = 30 arcmin−2 sample selected with a νthreshold ≥ 4.0 cut. The uncertainty due to halo triaxiality is included.
Other Images in This Article
Copyright and Terms & Conditions
© 2020. The American Astronomical Society. All rights reserved.
Copyright ©
2025 Astronomy Image Explorer. All Rights Reserved.