Image Details
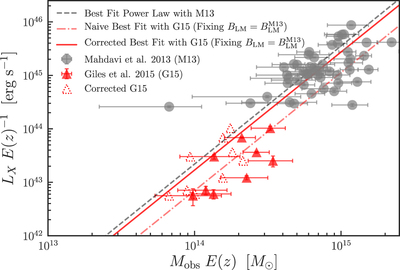
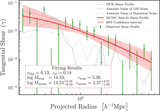
Caption: Figure 11.
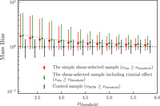
Analyses of the scaling relation between X-ray luminosity LX and cluster masses Mobs from weak lensing on the data set from Mahdavi et al. (2013) (gray circles) and Giles et al. (2015) (filled red triangles). A direct power-law fit to the M13 sample is shown by the dashed black line. The best-fit slope BLMM13 is fixed in the analyses on the G15 sample. The dashed–dotted red line shows the direct fit to the G15 sample, whereas the solid red line represents the corrected fit including the mass bias. The correction for each individual cluster in G15 is shown with open red triangles.
Other Images in This Article
Copyright and Terms & Conditions
© 2020. The American Astronomical Society. All rights reserved.
Copyright ©
2025 Astronomy Image Explorer. All Rights Reserved.