Image Details
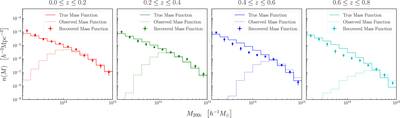
Caption: Figure 10.
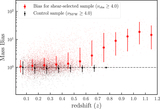
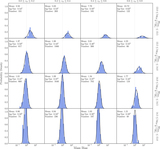
Reconstruction of input mass function from the observed number counts of shear-selected clusters selected in an ngal = 30 arcmin−2 sample with a νthreshold ≥ 4.0 cut. The dotted histograms show the observed number density of clusters in this sample, and the reconstructed mass functions are shown in error bars. The true number density in each bin based on the input mass function from Tinker et al. (2008) is plotted as the solid histogram.
Other Images in This Article
Copyright and Terms & Conditions
© 2020. The American Astronomical Society. All rights reserved.
Copyright ©
2025 Astronomy Image Explorer. All Rights Reserved.