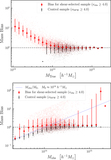
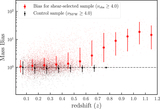
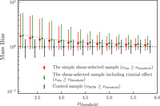
Image Details
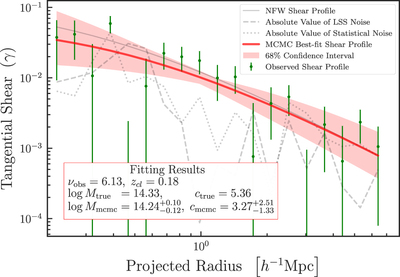
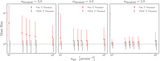
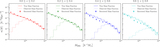
Caption: Figure 4.
Example of mock tangential shear profile and the resulting fit. Contributions from individual components ﹩{\gamma }_{\mathrm{NFW},i}^{\mathrm{bg}}﹩ (solid gray), ﹩{\gamma }_{\mathrm{LSS},i}^{\mathrm{bg}}﹩ (dashed), and ﹩{\gamma }_{\mathrm{STAT},i}^{\mathrm{bg}}﹩ (dotted) are shown for a typical cluster in our catalog with ﹩{n}_{\mathrm{gal}}=30\,{\mathrm{arcmin}}^{-2}﹩. The solid red line shows the best-fit shear profile with a 68% confidence interval for this particular case. The best-fit parameters are summarized in the inset.
Other Images in This Article
Copyright and Terms & Conditions
© 2020. The American Astronomical Society. All rights reserved.
Copyright ©
2025 Astronomy Image Explorer. All Rights Reserved.