Image Details
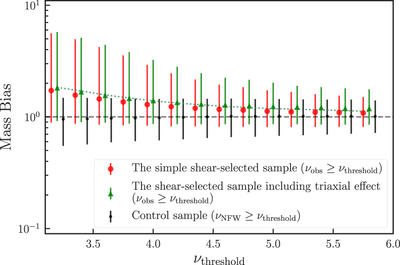
Caption: Figure 8.
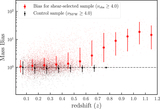
Mass bias (Equation (26)) as a function of the selection criterion νthreshold. The large red circles show the sample constructed in Section 2.1, whereas the green triangles represent the sample including the modification of halo triaxiality from Section 2.2. The dotted green line shows a quantitative estimate of the results with halo triaxiality (see Section 3.2 for details). The large red circles and the small black circles are slightly shifted leftward and rightward, respectively, from the green triangles to avoid overlaps.
Other Images in This Article
Copyright and Terms & Conditions
© 2020. The American Astronomical Society. All rights reserved.
Copyright ©
2025 Astronomy Image Explorer. All Rights Reserved.