Image Details
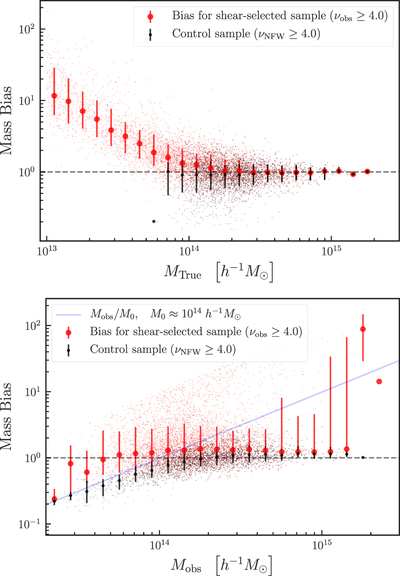
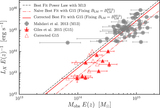
Caption: Figure 6.
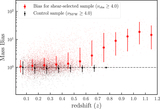
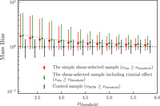
Mass bias (Equation (26)) as a function of true mass (top panel) and the observed weak-lensing mass (bottom panel). In both panels, large red circles correspond to the bias in the shear-selected cluster sample, whereas small black circles denote the bias in the corresponding control sample as in Figure 5. The solid blue line in the bottom panel shows the upper bound on the mass bias for the control sample.
Other Images in This Article
Copyright and Terms & Conditions
© 2020. The American Astronomical Society. All rights reserved.
Copyright ©
2025 Astronomy Image Explorer. All Rights Reserved.