Image Details

Caption: Figure 15.
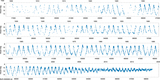
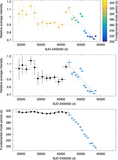
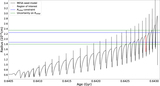
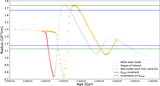
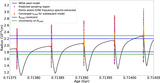
Still frame from the animation showing the evolution of the frequency content of the star. Top: the AAVSO light curve; the overlaid red line shows the position and width of the filter. Bottom: the corresponding LS frequency spectrum. Blue lines mark the original pulsation frequency and its two harmonics. Red marks the current period of the fundamental mode and the position of the first overtone.
(An animation of this figure is available.)
The video/animation of this figure is available in the online journal.
Other Images in This Article
Show More
Copyright and Terms & Conditions
© 2019. The American Astronomical Society. All rights reserved.
Copyright ©
2025 Astronomy Image Explorer. All Rights Reserved.