Image Details

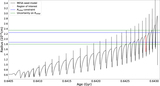
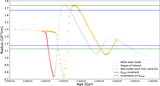
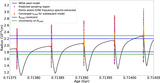
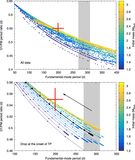
Caption: Figure 5.
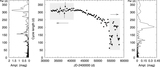
Top panel: change of pulsation-averaged relative intensity in T UMi. Color indicates the dominant period of each segment. Middle and bottom panels: the intensity and period values separately. Black points refer to the time span before the rapid period change; blue triangles refer to the time span of rapid period change. The gray solid and dashed lines in the upper and middle panels show the rates of −0.005 and −0.01 yr−1 in intensity, and the gray line in the lower panel is a ﹩\dot{P}=-3.2﹩ days yr−1 period change.
Other Images in This Article
Show More
Copyright and Terms & Conditions
© 2019. The American Astronomical Society. All rights reserved.
Copyright ©
2025 Astronomy Image Explorer. All Rights Reserved.