Image Details
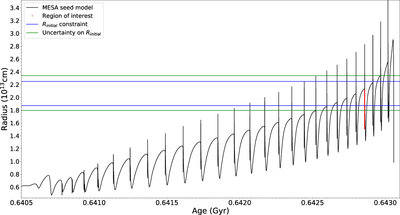
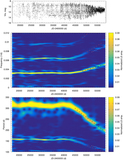
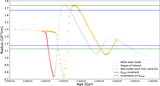
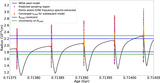
Caption: Figure 6.
The full pulse spectrum for a model with initial mass 2.6 M⊙ is shown. Blue horizontal lines indicate the observational radial constraint appropriate for this model, and green horizontal lines indicate the observational uncertainty. The region highlighted in red shows one of several downward radial transition phases for which we must generate densely sampled grids of structural models in order to track the evolution of the star’s frequency profile.
Other Images in This Article
Show More
Copyright and Terms & Conditions
© 2019. The American Astronomical Society. All rights reserved.
Copyright ©
2025 Astronomy Image Explorer. All Rights Reserved.