Image Details

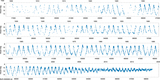
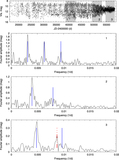
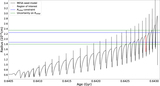
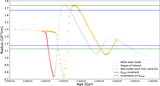
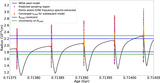
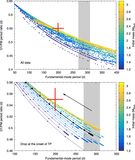
Caption: Figure 2.
Middle: distances of successive (local) light maxima. Left and right: the corresponding periodograms from the early (gray highlighted region in the upper left of middle panel) and late (gray highlighted region in the lower right) sections of the light curve. The “early” region covers truncated JD 32,000 to 41,000 and the “late” region, 54,500 to 58,500.
Other Images in This Article
Show More
Copyright and Terms & Conditions
© 2019. The American Astronomical Society. All rights reserved.
Copyright ©
2025 Astronomy Image Explorer. All Rights Reserved.