Image Details
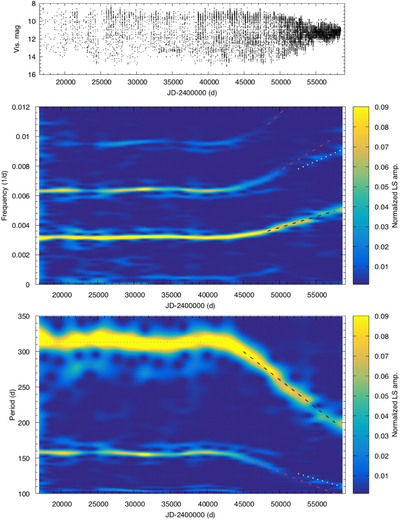
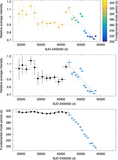
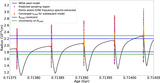
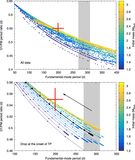
Caption: Figure 4.
Top panel: the visual data of T UMi. Middle panel: time–frequency distribution, bottom panel: time–period distribution. The main period is the strongest signal; the average, 313 days, pulsation period is marked with a thin gray dotted line. The black and red dashed lines show the (actual or expected) position of the fundamental period and its harmonics. The white dotted line is the position of the new mode.
Other Images in This Article
Show More
Copyright and Terms & Conditions
© 2019. The American Astronomical Society. All rights reserved.
Copyright ©
2025 Astronomy Image Explorer. All Rights Reserved.