Image Details
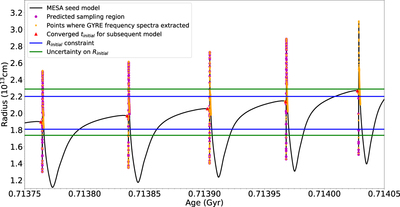
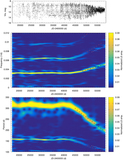
Caption: Figure 9.
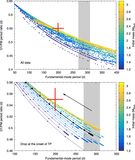
Predicted (purple) and actual (yellow) sampling locations for each viable pulsation are shown against the seed profile for a model with initial mass 2.5 M⊙. Blue and green horizontal lines are radial constraints, as in previous figures.
Other Images in This Article
Show More
Copyright and Terms & Conditions
© 2019. The American Astronomical Society. All rights reserved.
Copyright ©
2025 Astronomy Image Explorer. All Rights Reserved.