Image Details
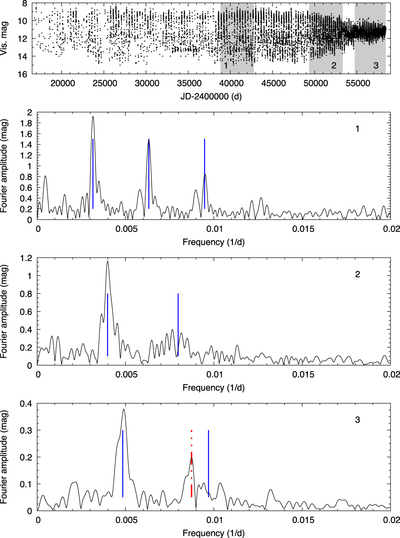
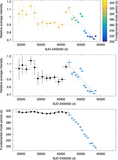
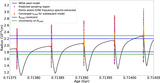
Caption: Figure 3.
Top panel: the AAVSO visual data of T UMi, with three different segments selected. Below: the Fourier spectra of each segment. Blue lines mark the dominant frequency and the positions of their harmonics at each panel. The red dotted–dashed line at the bottom panel marks the new, independent frequency component.
Other Images in This Article
Show More
Copyright and Terms & Conditions
© 2019. The American Astronomical Society. All rights reserved.
Copyright ©
2025 Astronomy Image Explorer. All Rights Reserved.