Image Details
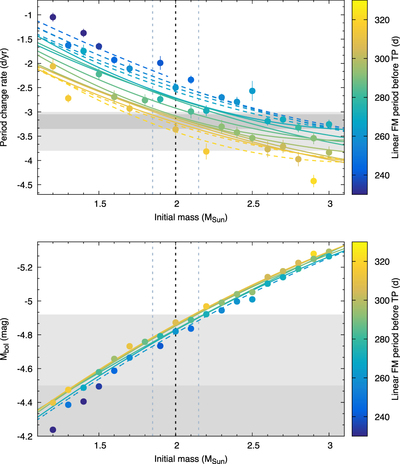
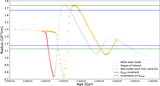
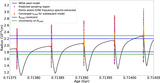
Caption: Figure 11.
Period change rate and bolometric magnitude values from the various TP models. Solid lines are the interpolated values for 10 day period increments. Gray shaded areas are observational constraints. Black and gray dashed lines mark the center and the edges of the best-fitting mass range.
Other Images in This Article
Show More
Copyright and Terms & Conditions
© 2019. The American Astronomical Society. All rights reserved.
Copyright ©
2025 Astronomy Image Explorer. All Rights Reserved.