Image Details
Caption: Figure 4.
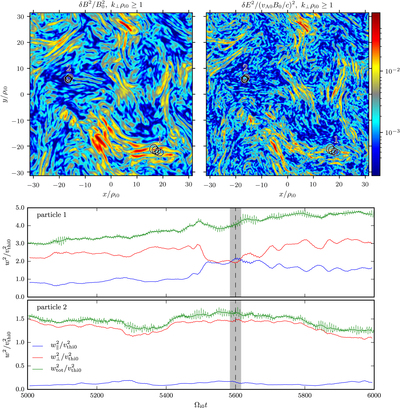
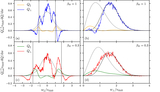
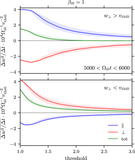
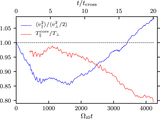
Example particle orbits from the ﹩{\beta }_{{\rm{i}}0}=1﹩ run. Snapshots of (top) magnetic-field (left) and electric-field (right) fluctuations in a plane perpendicular to the guide field on scales ﹩{k}_{\perp }{\rho }_{{\rm{i}}0}\geqslant 1﹩. Black lines show trajectories of two particles (labeled “1” and “2”) located in this plane. (Bottom) Parallel and perpendicular components of the thermal velocity ﹩{\boldsymbol{w}}\equiv {\boldsymbol{v}}-{{\boldsymbol{u}}}_{{\rm{i}}}﹩ measured with respect to the local magnetic field for each tracked particle vs. time. The vertical dashed line marks the time of the snapshot, with the gray region indicating the time over which particle’s trajectories are shown (≈4 Larmor orbits). Plotted velocity tracks are filtered over two gyro-orbits to suppress fluctuations; unfiltered w2's, denoted by thin green lines, suggest potential fluctuations along the orbit.
Other Images in This Article
Copyright and Terms & Conditions
© 2019. The American Astronomical Society. All rights reserved.