Image Details
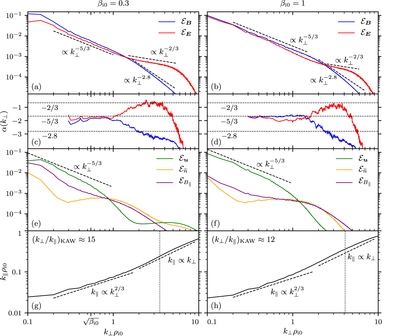
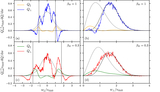
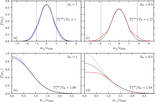
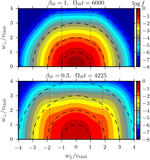
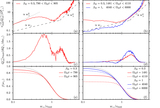
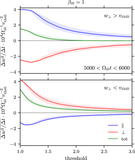
Caption: Figure 2.
((a) and (b)) Energy spectra of magnetic (blue) and electric (red) fields vs. k⊥ for ﹩{\beta }_{{\rm{i}}0}=0.3﹩ and ﹩{\beta }_{{\rm{i}}0}=1;﹩ their spectral indices α(k⊥) are shown in panels (c) and (d). Reference slopes are provided. ((e) and (f)) Energy spectra of ion flow velocity (orange), normalized density ﹩\widetilde{n}\equiv {n}_{{\rm{i}}}\sqrt{{\beta }_{{\rm{i}}0}(1+{\beta }_{{\rm{i}}0})}﹩ (green), and parallel-magnetic-field fluctuations (purple). Here, perpendicular (⊥) and parallel (∥) are measured with respect to ﹩{{\boldsymbol{B}}}_{0}﹩. ((g) and (h)) Spectral anisotropy of the magnetic-field fluctuations with respect to the scale-dependent local mean magnetic field, k∥(k⊥), computed using the method devised in Cho & Lazarian (2009). Vertical dotted lines mark the values of k⊥ at which ﹩{\omega }_{\mathrm{KAW}}={k}_{\parallel }{v}_{{\rm{A}}}{k}_{\perp }{\rho }_{{\rm{i}}}/\sqrt{1+{\beta }_{{\rm{i}}}}\approx {{\rm{\Omega }}}_{{\rm{i}}0}﹩.
Other Images in This Article
Copyright and Terms & Conditions
© 2019. The American Astronomical Society. All rights reserved.