Image Details
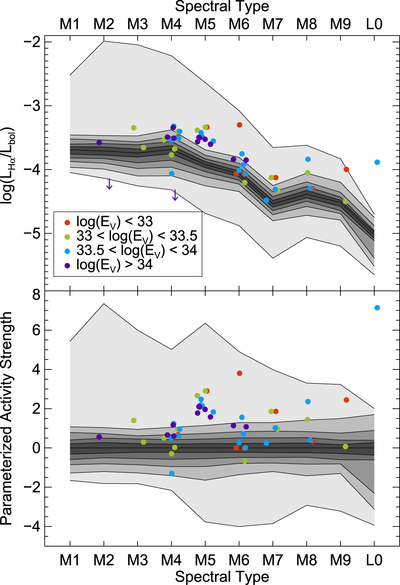
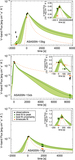
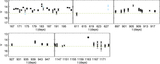
Caption: Figure 7.
The log of the ratio of Hα line luminosity to bolometric luminosity (Hα activity strength) as a function of spectral type (top panel) and the parameterized activity strength (activity strength normalized so the median value is 0 and the interval between 30% and 70% is unity) as a function of spectral type (bottom panel) for the West et al. (2011) and Schmidt et al. (2015) M dwarf samples compared to the activity strength and spectral type of the ASAS-SN flare sample. For the large M dwarf samples, the shaded areas show percentiles in increments of 10%. For the ASAS-SN flare sample, the different total flare energy is indicated by each point’s color.
Other Images in This Article

Copyright and Terms & Conditions
© 2019. The American Astronomical Society. All rights reserved.