Image Details
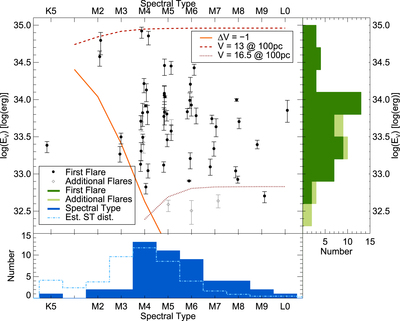
Caption: Figure 2.
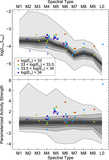
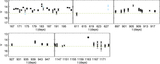
The log of the lower limit on V-band energy (﹩\mathrm{log}({E}_{V})﹩) as a function of spectral type. The lower-energy flares from M dwarfs with multiple flares (gray points, light-green histogram) are distinguished from the main sample of flares (black points, dark-green histogram). The lower-limit V-band energies range from ﹩\mathrm{log}({E}_{V}/\mathrm{erg})=32﹩ to 35 and are set by the detection limit of ASAS-SN (∼V < 16.5 mag, as shown in the red dashed lines). The spectral type distribution (dark blue) is comparable to a distribution drawn from the Bochanski et al. (2011) M dwarf luminosity function (light-blue dot-dashed line), where M3 and earlier dwarfs are underrepresented owing to the ASAS-SN detection limits. The lack of flares in the lower left corner is an observational effect; these flares would likely be smaller than ΔV = −1.0 (as shown by the orange line) and so unlikely to be found in the ASAS-SN search.
Other Images in This Article

Copyright and Terms & Conditions
© 2019. The American Astronomical Society. All rights reserved.