Image Details
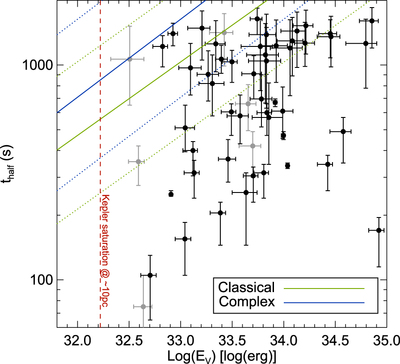
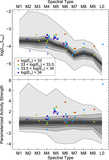
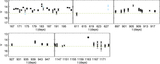
Caption: Figure 3.
Flare timescale (﹩{t}_{1/2}﹩) as a function of the log of the best-fit V-band energy. The ASAS-SN M dwarf flares are compared to estimates of flare timescale based on the correlation between total flare duration and Kepler flare energy from Hawley et al. (2014) and Silverberg et al. (2016), shown for both classical (green) and complex (blue) flares. Each relationship has an expected error on the order of a few percent, but the energies the fit is based on span an order of magnitude above and below the fit, shown here with dotted lines. A characteristic saturation limit for Kepler observations of flares on M dwarfs at 10pc is shown, based on the saturated data from GJ 1243 (red dashed line). The majority of Kepler flares analyzed in detail have energies below this line, so the relationships shown are extrapolations for energies greater than ﹩\mathrm{log}({E}_{V}/\mathrm{erg})\gt 32.2﹩.
Other Images in This Article

Copyright and Terms & Conditions
© 2019. The American Astronomical Society. All rights reserved.