Image Details
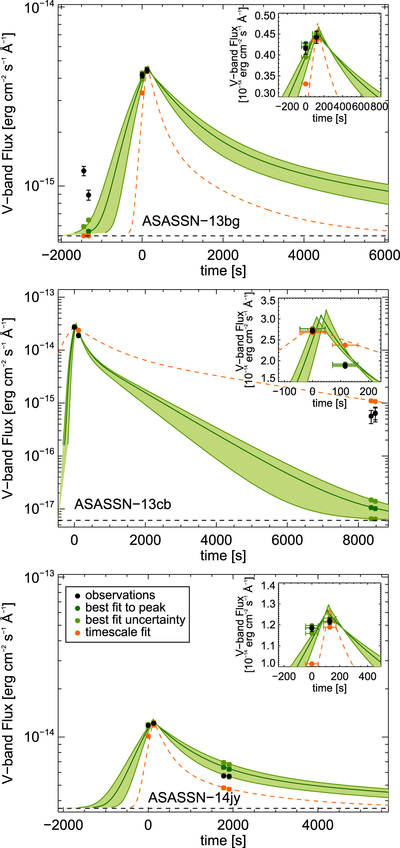
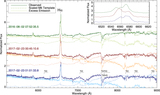
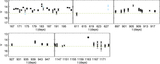
Caption: Figure 4.
V-band flare flux from ASASSN-13bg (top), ASASSN-13cb (middle), and ASASSN-14jy (bottom) as a function of time, with the inset showing the same data near the peak of the flare. The flare observations are shown (black points with uncertainties), as well as the quiescent flux value (black dashed line). The best-fit flare template is shown (dark-green line and points) with its uncertainties (light-green shaded area), as well as a flare template based on the relationship between total energy and timescale from Kepler data (orange line and points; see Section 4.2). The data points generated from each of these light curves integrated over a 90 s exposure time are also shown. For ASASSN-13bg and ASASSN-13cb, the data points far from the peak do not fall near the best-fit curve, but for ASASSN-14jy they do.
Other Images in This Article

Copyright and Terms & Conditions
© 2019. The American Astronomical Society. All rights reserved.