Image Details
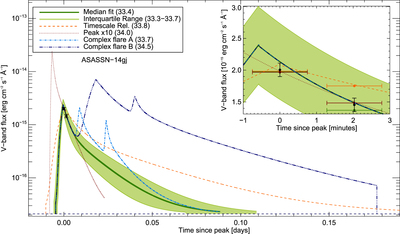
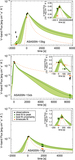
Caption: Figure 5.
V-band flare flux from ASASSN-14gj as a function of time over 0.2 days, with an inset showing flare flux as a function of time over 4 minutes. The flare data are shown (black points with uncertainties), as well as the quiescent value (black dashed line). For each example flare shown, the full light curve is plotted (lines) along with the fluxes integrated over the exposure time of the data (90 s; points with horizontal error bars). The flare timescale fit to the data is shown (dark green line) with its uncertainties (light green shaded area), as well as a flare calculated to fall along the relationship between flare energy and duration found from Kepler data for GJ 1243 (orange dashed line; Hawley et al. 2014; Silverberg et al. 2016). A light curve with a peak at 10 times the observed peak is shown (red dotted lines), and two possible complex flares with multiple peaks are shown (dot-dashed light-blue and triple-dot-dashed dark-blue lines). For reference the log of the V-band energies under each of these curves is given in the legend.
Other Images in This Article
Copyright and Terms & Conditions
© 2019. The American Astronomical Society. All rights reserved.