Image Details
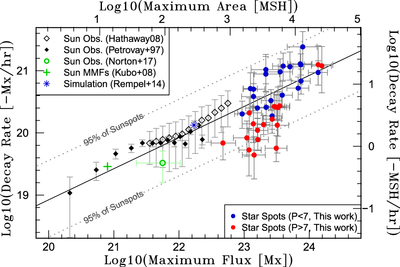
Caption: Figure 9.
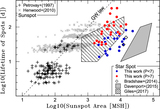
Comparison between the maximum magnetic flux (Φ) and decay rate (dΦd/dt) of sunspots and star spots on solar-type stars. Black open and filled diamonds are sunspot observations by Hathaway & Choudhary (2008) and Petrovay & van Driel-Gesztelyi (1997), respectively. Note that the error bars of Hathaway & Choudhary (2008) indicate the 1σ level of their data, and those of Petrovay & van Driel-Gesztelyi (1997) indicate the 3σ level. As for the data of Petrovay & van Driel-Gesztelyi (1997), the area is not the maximum area but the area when the decay rates are measured. A green circle shows sunspot observations with the SDO magnetogram (Norton et al. 2017), and the green cross is the sunspot decay rate owing to moving magnetic features (MMFs; Kubo et al. 2008). Blue and red circles correspond to the spots analyzed in this study with Prot < 7 days and Prot > 7 days, respectively. Blue asterisks are the result of a simulation performed by Rempel & Cheung (2014). Dotted lines are the upper and lower 95% confidence levels for the sunspot observations (Hathaway & Choudhary 2008). Located in this extrapolation of 95% confidence interval are 89% of the star spots. The solid line is the line of dΦd/dt ∝ Φ0.5, where the absolute values are derived based on the mean values of the sunspot observations (Hathaway & Choudhary 2008).
Other Images in This Article

Copyright and Terms & Conditions
© 2019. The American Astronomical Society. All rights reserved.