Image Details
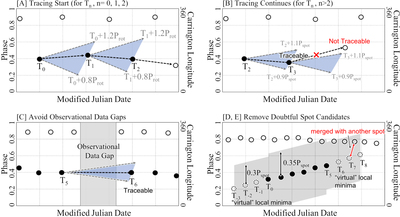
Caption: Figure 2.
Schematic pictures to explain the method ([A]–[E]) of tracing the local minima described in Section 2.2. All panels correspond to the phase-time diagram of the local minima, which is similar to Figure 1(c). The panels are described as follows: [A] explains how to start the tracing and identification of spots, [B] explains how to continue the tracing after the identifications, [C] explains how to avoid the observational data gaps, and [D, E] explains how to remove the spot candidates that can merge with other spots in longitudes that are originally located at the separated longitudes. If there are other local minima in the gray region, the spot candidates are removed in our algorithm.
Other Images in This Article


Copyright and Terms & Conditions
© 2019. The American Astronomical Society. All rights reserved.