Image Details
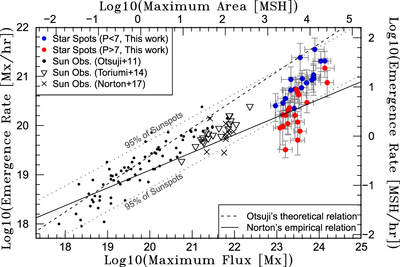
Caption: Figure 8.
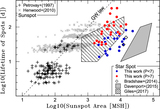
Comparison between the maximum magnetic flux (Φ) and emergence rate (dΦe/dt) of sunspots and star spots on solar-type stars. Black points, triangles, and crosses are the sunspot observational data taken from Otsuji et al. (2011), Toriumi et al. (2014), and Norton et al. (2017), respectively. Blue and red circles correspond to the spots analyzed in this study with Prot < 7 days and Prot > 7 days, respectively. Solid (dΦe/dt ∝ Φ0.3) and dashed (dΦe/dt ∝ Φ0.5) lines are scaling relations derived by Norton et al. (2017) and Otsuji et al. (2011), respectively. The standard deviations of the star-spot data compared with the scaling laws are 7.1 × 10²⁰ and 9.5 × 10²⁰ for Norton’s and Otsuji’s scaling laws, respectively. Dotted lines are the upper and lower 95% confidence intervals for the sunspot observations, and 76% of the star spots are located in the extrapolation of this 95% confidence interval.
Other Images in This Article

Copyright and Terms & Conditions
© 2019. The American Astronomical Society. All rights reserved.