Image Details
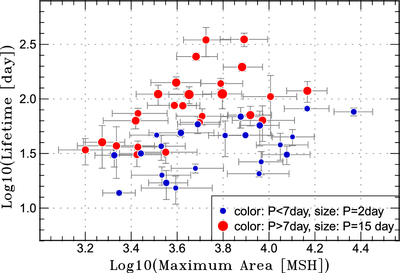
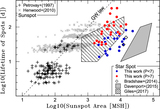
Caption: Figure 6.
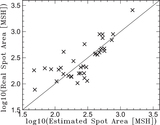
Comparison between maximum areas and lifetimes (T) of the detected star spots on solar-type stars. The area is plotted in units of MSH (1 MSH = 10−6 × 2πR⊙2). The size of each circle represents the stellar rotational period. Blue and red colors correspond to the spots with Prot <7 days and Prot > 7 days, respectively.
Other Images in This Article


Copyright and Terms & Conditions
© 2019. The American Astronomical Society. All rights reserved.
Copyright ©
2025 Astronomy Image Explorer. All Rights Reserved.