Image Details
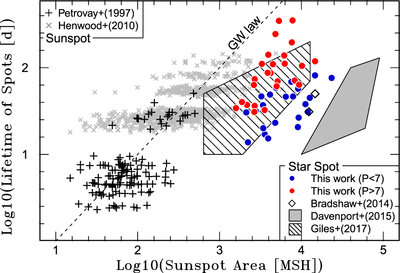
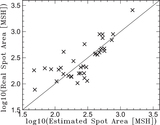
Caption: Figure 7.
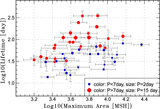
Comparison between maximum spot area and lifetime of sunspots and star spots on solar-type stars. Black and gray symbols are sunspots data taken from Petrovay & van Driel-Gesztelyi (1997) and Henwood et al. (2010), respectively. The dashed line indicates the solar GW relation (A = DT, D ∼ 10 MSH day−1). Blue and red circles correspond to the spots analyzed in this study with Prot < 7 days and Prot > 7 days, respectively. Open diamonds are star spots on G-type stars (Kepler-17 and CoRoT-2) taken from Bradshaw & Hartigan (2014), which were estimated by using exoplanet transits. The gray shaded region indicates star spots on Kepler-17 detected in Davenport (2015). Note that the area and lifetimes of star spots on Kepler-17 are also estimated in Bradshaw & Hartigan (2014), but there is a factor gap in spot area between Bradshaw & Hartigan (2014) and Davenport (2015). A region filled with diagonal lines indicates the result of Giles et al. (2017).
Other Images in This Article


Copyright and Terms & Conditions
© 2019. The American Astronomical Society. All rights reserved.