Image Details
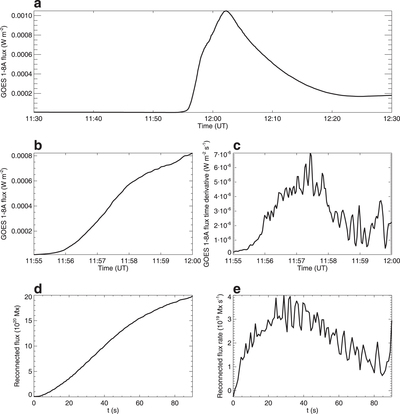
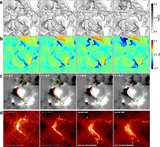
Caption: Figure 15.
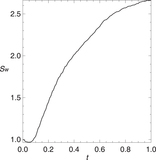
Reconnected flux as compared with the profile of X-ray flux. (a) The GOES soft X-ray flux (1–8 Å) from 11:30 to 12:30, 2017 September 6. (b) Same as (a) but for a small interval of 5 minutes starting from the beginning of the flare. (c) The time derivative of the flux shown in (b). (c) The temporal evolution of reconnected flux in the simulation. (d) Time derivative of the reconnection flux curve, i.e., reconnection flux rate.
Other Images in This Article

Show More
Copyright and Terms & Conditions
© 2018. The American Astronomical Society. All rights reserved.
Copyright ©
2025 Astronomy Image Explorer. All Rights Reserved.