Image Details
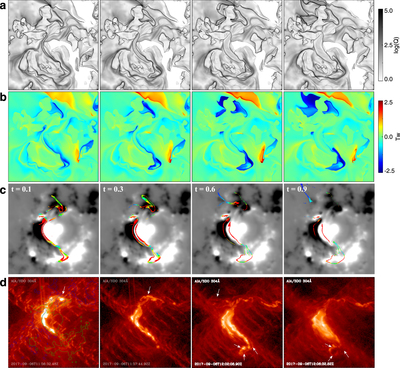
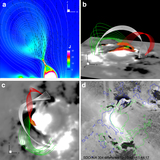
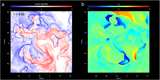
Caption: Figure 9.
Structures and evolution at the bottom surface. (a) Magnetic squashing degrees. (b) Magnetic twist numbers. An animation of the temporal evolution of the magnetic squashing degree and twist number is provided in Figure 10. (c) Magnetic footpoints (colored dots) of the field lines that are traced from the CS to the bottom surface. The colors represent the strength of local magnetic field, red for strong and blue for weak. (d) SDO/AIA 304 Å images of the flare ribbons. The arrows denote the two weak ribbons that form in the far-side polarities P1 and N1. An animation of the evolution of the flare ribbon is provided in Figure 11. The ribbons as observed in this channel look rather diffuse, but the AIA UV channels of 1600 and 1700 Å are overexposed in this flare.
Other Images in This Article

Show More
Copyright and Terms & Conditions
© 2018. The American Astronomical Society. All rights reserved.