Image Details
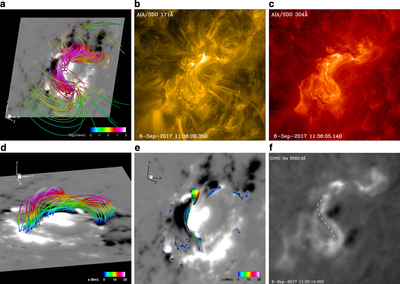
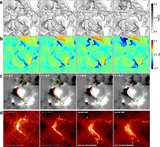
Caption: Figure 2.
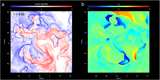
Comparison of the reconstructed magnetic field with the observed features of the solar corona prior to the flare. (a) SDO view of sampled magnetic field lines of the NLFFF reconstruction. The color of the lines represents the value of current density J (normalized by its average value Jave in the computational volume). The background is the photospheric magnetogram. (b) and (c) SDO/AIA 171 Å and 304 Å images of the pre-flare corona. (d) The low-lying magnetic field lines in the core region. The field lines are color-coded by the value of height z. (e) Locations of dips in the magnetic field lines; the color indicates the value of height z. (f) GONG Hα image of the AR. The dashed curve denotes the location of a long filament.
Other Images in This Article

Show More
Copyright and Terms & Conditions
© 2018. The American Astronomical Society. All rights reserved.