Image Details
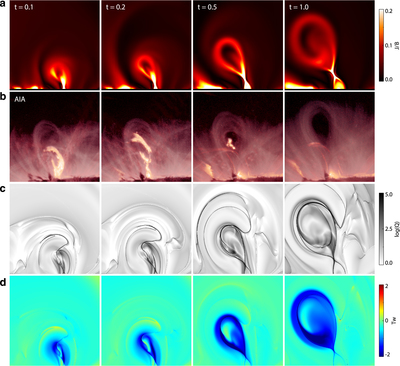
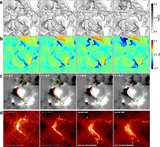
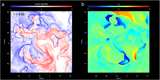
Caption: Figure 4.
Temporal evolution of the eruptive structure in a 2D view. (a) Distribution of current density on the vertical cross section (the y = 0 plane). Here the current density is normalized by local magnetic field strength, which provides a high contrast of thin current layers with other volumetric currents. The unit of J/B is 1/Δ where Δ is the grid size. (b) SDO/AIA images of the X8.2 flare observed at the solar limb. The images are made by a combination of the two AIA channels 211 Å and 304 Å, and they are rotated to roughly match the direction of the simulated eruption. (c) and (d) Distributions of magnetic squashing degree Q and twist number Tw, respectively, in the same cross section as in (a).
Other Images in This Article

Show More
Copyright and Terms & Conditions
© 2018. The American Astronomical Society. All rights reserved.