Image Details
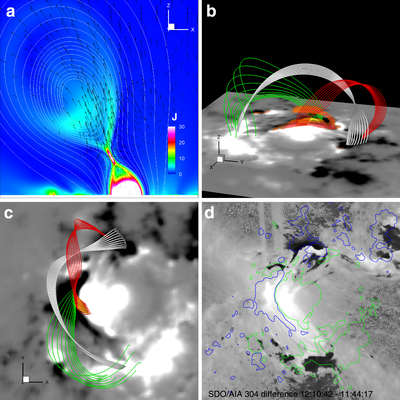
Caption: Figure 5.
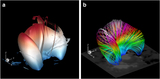
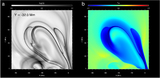
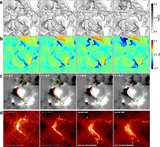
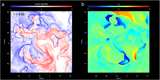
Illustration of the reconnection process below the rising MFR. (a) Current density distribution and plasma flows (denoted by arrows) on the vertical cross section (the y = 0 plane) at time t = 1.0. The white lines are 2D field lines tracing on the plane. (b) 3D configuration of the reconnection. The white lines are within the main body of the MFR. The red and green lines are reconnecting field lines below the rope. Their inner footpoints are sheared past each other along the PIL, and thus the field directions change abruptly across the CS, in which reconnection takes place, resulting in a long field line joining the MFR and a short arcade below which the post-flare loops form (as shown by the yellow lines). The objects colored in red and orange are thin layers with the strongest current density throughout the volume, showing the CS in 3D. (c) Top view of the same magnetic field lines shown in (b). (d) Difference of AIA 304 Å images before and after the flare, showing two dimming sites (or transient coronal holes) that match the locations of the MFR legs. The contour lines are shown for Bz = −500 G (colored in blue) and 500 G (colored in green).
Other Images in This Article

Show More
Copyright and Terms & Conditions
© 2018. The American Astronomical Society. All rights reserved.