Image Details
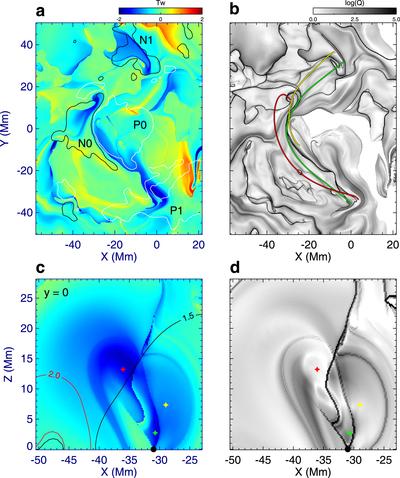
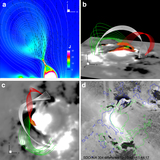
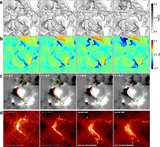
Caption: Figure 3.
Detailed configuration of the reconstructed pre-flare magnetic field. (a) Map of magnetic twist number Tw at the bottom surface z = 0. Overlaid are contour lines for Bz = 500 G (white) and −500 G (black). Coordinates are the same as shown in Figure 1(d). (b) Map of magnetic squashing factor Q at the bottom. The black thin lines formed by large Q values are locations of magnetic topology separatrices and QSLs where the magnetic field-line mapping is discontinuous or changes rapidly. Three field lines with different colors are plotted to represent the magnetic flux of the different connections that make up the MFR. (c) Distribution of twist number in a vertical cross section (y = 0). The three colored stars denote the intersection points of the sample field lines shown in (b) with the cross section. The black circle indicates the main PIL. The contour lines are shown for the decay index n = 1.5 and 2. (d) Distribution of magnetic squashing factor Q in the same cross section shown in (c).
Other Images in This Article
Show More
Copyright and Terms & Conditions
© 2018. The American Astronomical Society. All rights reserved.