Image Details
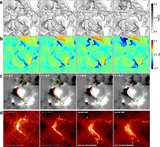
Caption: Figure 14.
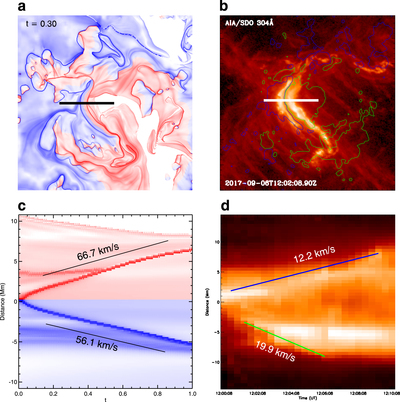
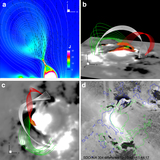
Comparison of flare-ribbon separation speed from MHD simulation and from observation. (a) The QSL map on the bottom at time t = 0.3. The black line segment denotes the location where a stacked time sequence is plotted in (c) for tracking the separation of the main QSLs that maps the reconnection footpoint. (b) SDO/AIA 304 Å image of the flare ribbons. In the same way, the white line segment is the location of the time stack shown in (d), which shows the separation motion of the main flare ribbons. The lines shown in (c) and (d) represent approximately the speeds of the ribbons.
Other Images in This Article

Show More
Copyright and Terms & Conditions
© 2018. The American Astronomical Society. All rights reserved.
Copyright ©
2025 Astronomy Image Explorer. All Rights Reserved.