Image Details
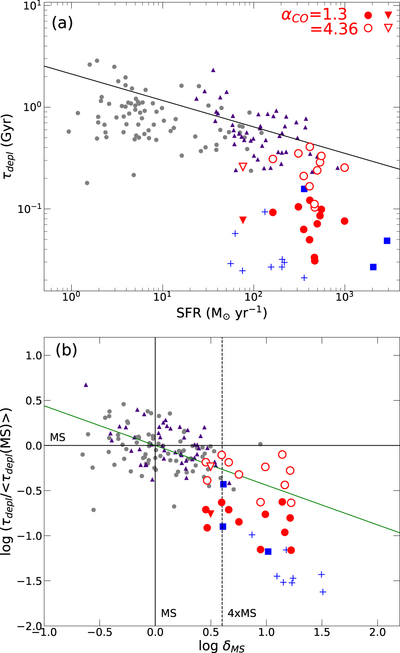
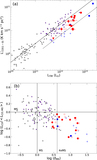
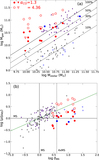
Caption: Figure 8.
(a) Gas depletion time (τdepl = Mgas/SFR) of high-redshift starbursts as a function of their SFR. The slanted black line is the best-fit relation from Sargent et al. (2014). (b) Gas depletion time vs. sSFR with both normalized to average values for SF MS galaxies. An analytic form of this relation is provided by Tacconi et al. (2017) and shown here in green. Symbols in both panels are the same as in Figure 6.
Other Images in This Article
Copyright and Terms & Conditions
© 2018. The American Astronomical Society. All rights reserved.
Copyright ©
2025 Astronomy Image Explorer. All Rights Reserved.