Image Details
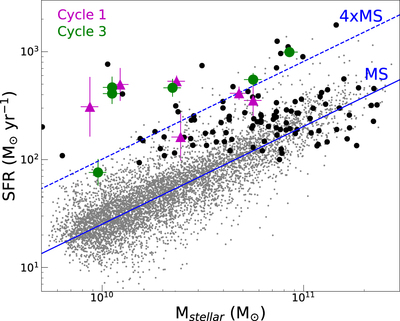
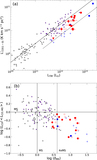
Caption: Figure 1.
SFR vs. Mstellar for star-forming galaxies (including starbursts detected by Herschel) at 1.4 < z < 1.7. The large colored symbols indicate the 12 starbursts observed by ALMA (Cycle 1: magenta; Cycle 3: green) that constitute the focus of our study. With black symbols, we indicate the location of Herschel-detected galaxies that have spectroscopic redshifts over the same interval from the FMOS-COSMOS survey. Smaller circles show the location of MS galaxies (gray) having photometric redshifts from Laigle et al. (2016). The solid line indicates the MS, as determined by a fit to the gray data points having sSFR > 2 × 10⁻¹⁰ yr−1, and a parallel track (dashed) at an elevated rate of 4× above the MS that illustrates the typical boosts in SFR for our starbursts.
Other Images in This Article
Copyright and Terms & Conditions
© 2018. The American Astronomical Society. All rights reserved.