Image Details
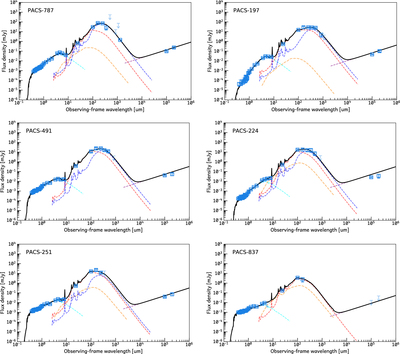
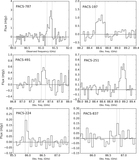
Caption: Figure 2.
SEDs of our Cycle 3 sample from IR to radio wavelengths (photometric data are shown in blue), with the best-fit model shown by the black curve. The model of the dust emission is given for both a warm (red) and a cool (purple) component that contributes to the mid- to far-infrared emission. The unobscured stellar emission is shown by the cyan curve. An AGN contribution (yellow) is negligible for all cases.
Other Images in This Article
Copyright and Terms & Conditions
© 2018. The American Astronomical Society. All rights reserved.
Copyright ©
2025 Astronomy Image Explorer. All Rights Reserved.