Image Details
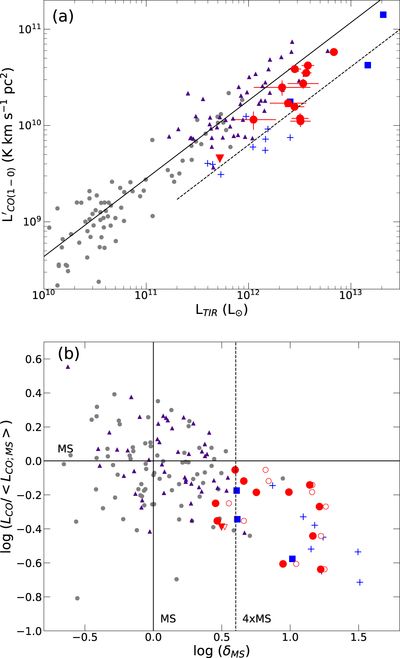
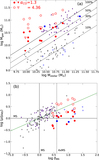
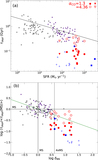
Caption: Figure 6.
(a) CO (1−0) luminosity (﹩{L}_{\mathrm{CO}}^{{\prime} }﹩) as a function of total infrared luminosity (LTIR) and (b) CO luminosity and sSFR both normalized to the mean value of typical star-forming MS galaxies as described in the text. Red (filled) data points mark our 12 high-z starbursts. The inverted triangle represents the 3σ upper limit for PACS-837. The red open symbols are equivalent to the red filled symbols with the exception that the value of δMS is in reference to the star-forming MS of Speagle et al. (2014). From the compilation of Sargent et al. (2014) as described in Section 2.4, the small gray circles (purple triangles) represent star-forming MS galaxies at z < 1 (z > 1), while blue symbols show the local ULIRGs (plus signs) and high-z starbursts (filled blue squares). In panel (a), the best-fit relation to MS galaxies is shown by the solid line with a similar relation shifted 3× lower to indicate the location of local ULIRGs (Sargent et al. 2014).
Other Images in This Article
Copyright and Terms & Conditions
© 2018. The American Astronomical Society. All rights reserved.