Image Details
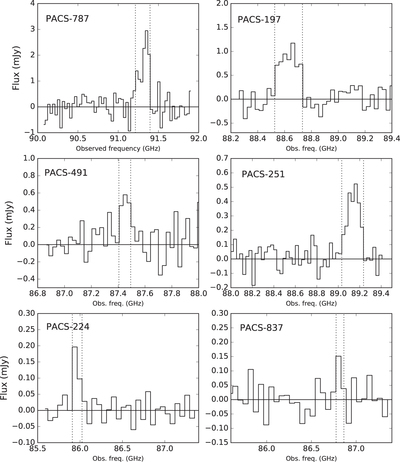
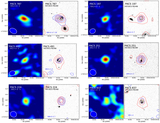
Caption: Figure 5.
CO (2−1) spectra for the Cycle 3 ALMA sample. Observed velocity channels are binned in intervals of 100 (PACS-787, 197, 491, 251) or 200 (PACS-224, 837) km s−1. Spectra were extracted with different apertures for each source chosen to closely represent the unresolved (i.e., peak) CO emission. The vertical dotted lines indicate the velocity interval over which the total CO luminosity is measured as given in Table 2. The horizontal line marks the zero level.
Other Images in This Article
Copyright and Terms & Conditions
© 2018. The American Astronomical Society. All rights reserved.
Copyright ©
2025 Astronomy Image Explorer. All Rights Reserved.